The real story isn't a 33% drop in U.S. GDP - its the 25% personal savings ratio
Mnuchin money.
Ooh, that’s gotta hurt.
Okay, let’s get the expected bit out the way.
June quarter GDP in the U.S. collapsed by 32.9% (annualised). Unprecedented during U.S. GDP recorded history.

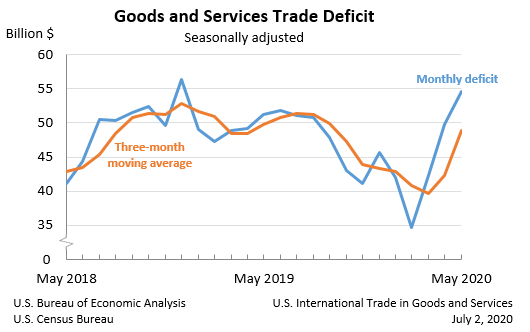
The trade deficit increased by $20 billion over 3 months, so call it a $7 billion average increase per month.

This general trend and even the size of the GDP crater was expected, within a couple of percentage points.
But check out the 25% personal savings (to disposable income) ratio.
Today’s announced disposable income metrics show where a lot of the Mnuchin money has gone:
Disposable personal income increased $1.53 trillion, or 42.1 percent, in the second quarter, compared with an increase of $157.8 billion, or 3.9 percent, in the first quarter. Real disposable personal income increased 44.9 percent, compared with an increase of 2.6 percent.
Personal outlays decreased $1.57 trillion, after decreasing $232.5 billion. The decrease in outlays was led by a decrease in PCE for services.
Personal saving was $4.69 trillion in the second quarter, compared with $1.59 trillion in the first quarter. The personal saving rate—personal saving as a percentage of disposable personal income—was 25.7 percent in the second quarter, compared with 9.5 percent in the first quarter.
So, families received $1.53 trillion and spent $1.57 trillion less.
When added to the $1.59 trillion of saving in the first quarter, this makes a personal saving total of $4.69 trillion at the end of June.
The figures imply that 25% of disposable personal income (remembering a lot of this is welfare from Mnuchin) was saved. And saved includes/means invested. Spending confidence has evaporated, Goods and services are dis-inflating. Price inflation has not finished its jump to asset inflation.
The politicians and the Fed.
Today’s figures are sure to fuel even more furious debate between GOP and the Democrats over the size, eligibility and timing of additional PPP and unemployment payments, given they end tomorrow.
Volatility (measured by S&P500 option volatility via the VIX) is up 14%, equities are down and the U.S. 10 year bond yield is now below 0.55%. U.S. 2 year yields may as well be o%.
Industrial growth indicators like oil, silver and Caterpillar are down. Rail freight carloads have dropped 20% since March, the lowest level in the past 20 years.
However, AMD, Qualcomm and a few select growth stocks are up, and if Apple reports well at after tonight’s session, Robinhood and his band of crazies might be back to steal some more treasure from the sheriff on Friday.
Meanwhile, the Fed continues to extend, support, prop up and insure because like the ECB and the BOE, the only thing they have to fear with a 25% personal savings ratio, is deflation itself.
Mike.
All metrics and charts sourced from the U.S. Department of Commerce.
NextLevelCorporate is a leading independent strategic corporate advisory firm with a multi-decade track record of delivering transformative corporate finance solutions, in and out of Australia.
All text is copyright to NextLevelCorporate.