Low prices in July cured by higher commodity prices in March

Image: Patrycja Grobelny.
March was the high watermark for commodity price acceleration
The massive deceleration in prices for Australian hard commodities in July are a result of the extreme price accelerations between January and March 2022.
Higher prices are a cure for high prices.
Here are the latest charts to demonstrate this old adage.

NextLevelCorporate chart utilising RBA commodity price index data.
Notes: At NLC we use spot prices (particularly for non-terminal commodities like iron ore and coal) because they provide better price discovery for the next incremental tonne that’s not been contracted. In turn, that reveals forward sentiment. We use SDR to neutralise the USD wrecking ball skew to commodity prices.
Spot prices for base metals decelerated twice as fast in July as they did in June and at around the same rate of deceleration that we witnessed in May.
Most of this is copper and aluminium, while nickel makes up a tiny part of the index with base metals making up 3.6% in total.
Steel making and thermal bulks decelerated faster in June and July
Spot iron ore and coal (coking and thermal/heating) which make up 56% of the Dragon’s share of the index decelerated 0.4x faster than in June but they slowed over 4x faster than in May.

NextLevelCorporate chart utilising RBA commodity price index data.
Notes: At NLC we use spot prices (particularly for non-terminal commodities like iron ore and coal) because they provide better price discovery for the next incremental tonne that’s not been contracted. In turn, that reveals forward sentiment. We use SDR to neutralise the USD wrecking ball skew to commodity prices.
And as you’ve probably heard, China’s debt fuelled economy is again failing (inflation is low due to zero-COVID lockdowns).
Yesterday, the Dragon’s banker cut official interest rates by a measly 10 basis points in an attempt to stimulate growth/inflation.
10 basis points is like tipping a thimble of water into a Desert.
Hydrocarbons (17% of index) are heading south, but not for always
Meanwhile, the EU is working on its natural gas supply plans for winter, as it moves to wean itself off Russian gas and crude (well, direct imports anyway😉).
Some commentators are now predicting high crude oil prices (one of the major contributors to this contraction) to be the last commodity to get belted in terms of demand and price.
Forecasts are for a fall back of somewhere between $85-90pb - where it happens to be trading today mostly because of China’s failing economy.

Source: St. Louis Fed
But even when oil dips once the exigent circumstances caused by COVID-19 and accelerated by Putin’s invasion attack on Ukraine are fully factored in, it does not mean that oil and coal won’t be required for many more years to come.
They will because the world is nowhere near being ready for a green economy and more Australian originated natural gas available for other countries might be diverted to Europe despite transportations costs. And China’s zero-COVID could remain in place for a long time.
All of the above have contributed to economic contraction (and almost universal bearish sentiment).
Economic contraction in the world’s reserve economy
Purchasing manager indexes around the world are down, and in the U.S., with all forward looking eyes on the ISM PMI for August.
And last night, the Empire State Manufacturing Survey came out with a massive fall to a negative print.
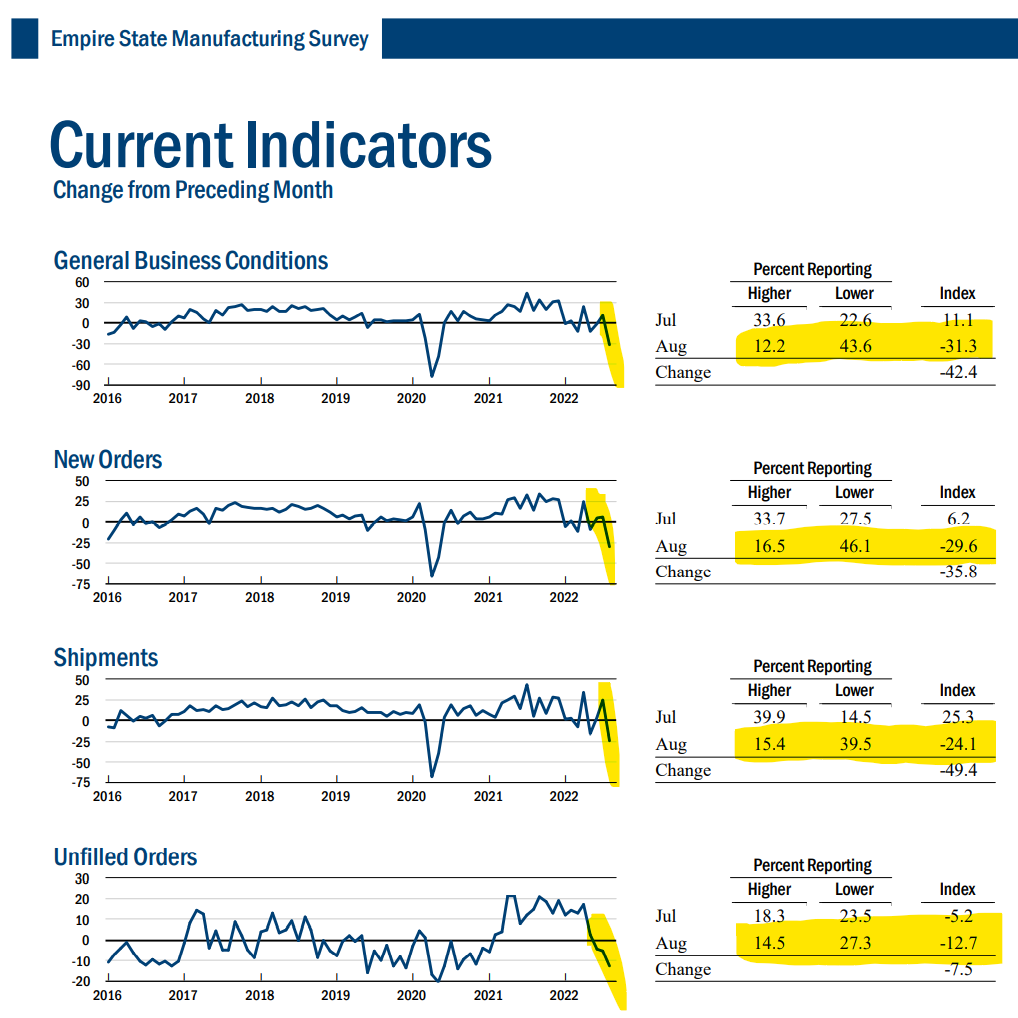
Source: Federal Reserve Bank of New York.
And last week’s data from the U.S. Department of Labour revealed that while U.S. job additions surprised on the upside in July (with a print of 528,000) initial jobless claims for July were up to 260,000, representing ~50% of new jobs.

Source: U.S. Department of Labour
What’s more is that this metric has been ripping since April and is now back up to levels that were last seen in November last year.
Continuing claims (defined as insured unemployment in chart 2 above) are also on the rise after inflecting in June.
This data series is indicative of emerging labour market conditions across the U.S., and a leading indicator. It tells me there is more slowdown and pain to come.
World reserve currency treasury yield curve inverted on the 10
All U.S. treasury maturities from 6 months to 7 years are inverted (higher) on the 10 year.
And now, the 3 month treasury note is only 7 basis points below the 10 year treasury bond, with that inversion looking more likely to occur over the next couple of weeks (i.e., 2.72% for the 90 day treasury versus 2.79% on the 10 year).
If all of the above continues, it brings recession into plain view and a Fed pause on interest rate hikes and potential pivot closer, and that in turn puts a rocket under risk assets - and also paints a different coloured blush on bonds, because as yields come down, prices go up. It’s when bad news again becomes good news for risk assets.
But in between the ‘too tight’ and ‘not tight enough’ machinations being discussed amongst central bankers, real markets are experiencing heightened levels of volatility.
So, don’t be surprised if you see some crazy ass valuations and dislocations in most markets (and some corporate collapses you weren’t expecting).
A green minerals and metals M&A window due to cured (curing) prices?
The stage is now set for M&A in most commodities that are going to be critical for the future green transition as their current valuations crimp in response to global economic contraction just now.
BHP’s valuation-opportunistic tilt at Oz Minerals is a recent illustration of the cyclical low point in this secular trend.
But just like 007, these commodities will return with spectacular vengeance once the contraction is over and side-lined cash is redeployed with secular conviction.
In summary, lower July commodity prices cured by high the watermark in March
Commodity prices have been decelerating since April, after inflation hit a 40 year high of 8.5% in March, sending the western world into a populist spin.
Since then, U.S. CPI peaked at 9.1% in June (a higher high) and then rolled over to 8.5% in July.
That was enough to crimp demand.
We can probably now conclude that low commodity spot prices in July (as well as recent bear rallying equity prices) are probably a result of the higher prices which accelerated between January and March 2022. Mining company M&A is likely to increase. And, higher interest rates in the face of rolling over prices, demand and anaemic M2 productivity will likely deter growth and become a vaccine for higher official interest rates.
By 2023, it’s possible that you’re going to look back and say, well, inflation was transitory. And if you do that, it’s probably going to be from the comfort of a familiar carriage aboard the wood and coal powered Powell/Lagarde QE Infinity train to nowhere.
Can you smell the steam yet?
Mike 👋

Image: Alexander Zvir
Next Level Corporate Advisory is a leading M&A and capital markets advisor with a 20 year track record of delivering the highest quality of independent financial advice as well as strategic transactions to help companies of all sizes level-up, in and out of Australia.
All text in this article is copyright NextLevelCorporate.