
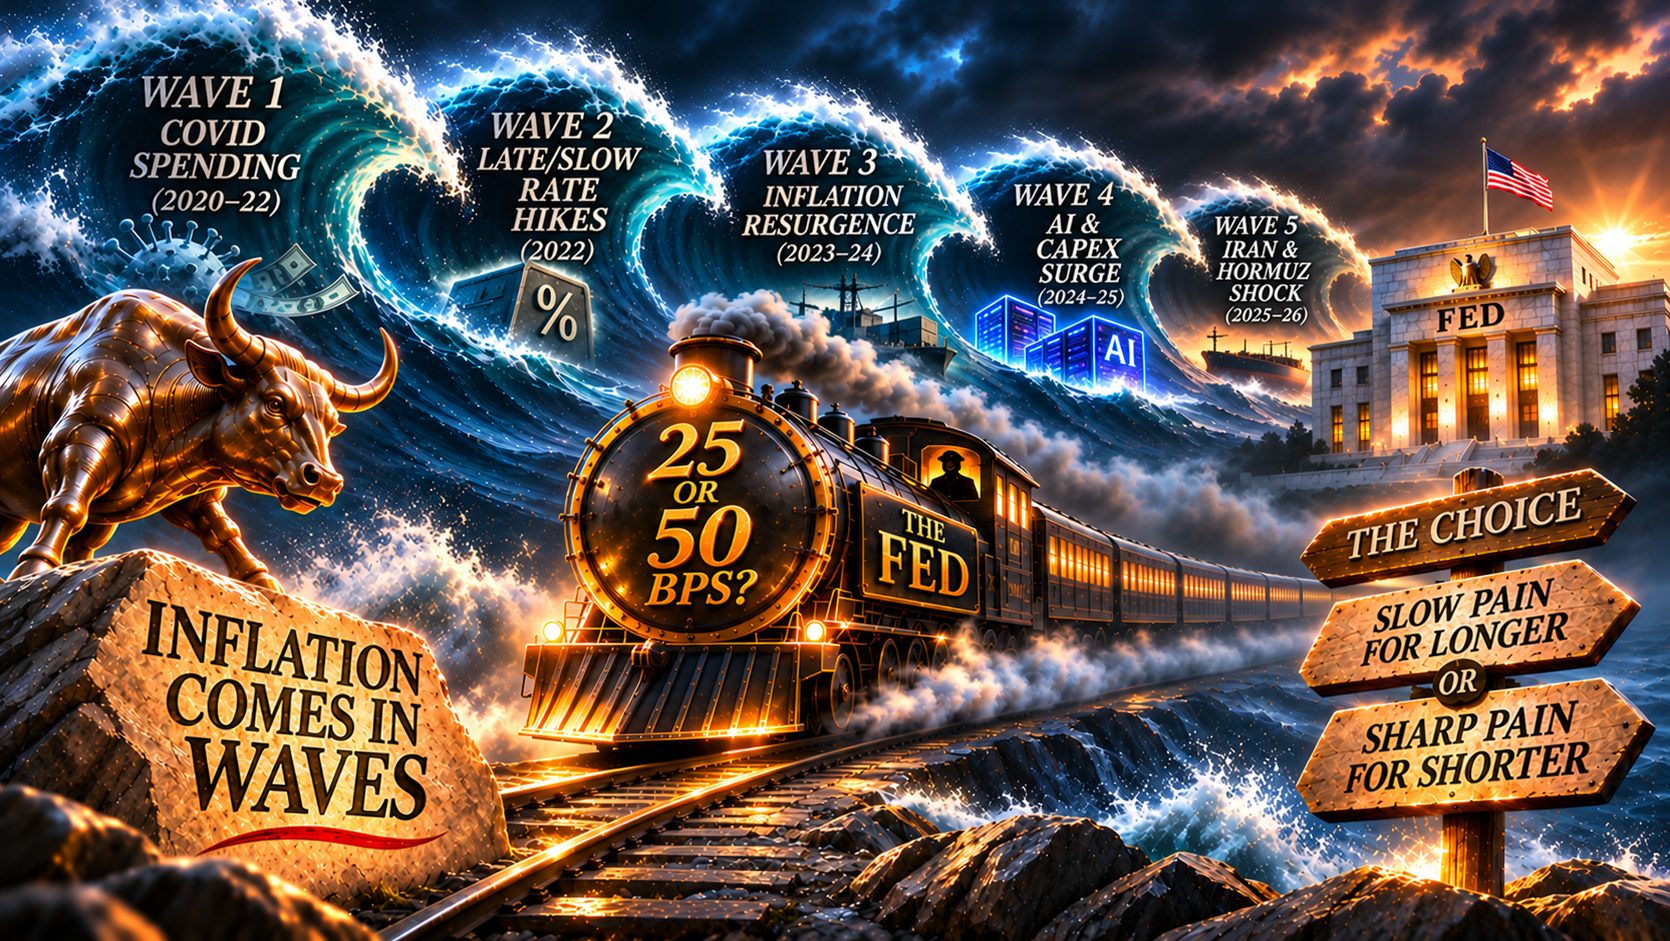
“The train, not the Tweet”. Copyright 2026. nextlevelcorporate. nextlevelcorporate prompts, AI generated image.
TL; DR
A Fed governor has put a 50 basis point hike on the table for December, and now the market is arguing about 25 or 50. A basis point is one hundredth of a percent, so 50 is half a percentage point. But ask yourself a simpler question. Is this really a new inflation problem? Or is it the next wave of an old one, with the size of the hike just the loudest part of the story?
The story we were told
The version on every screen goes like this. Inflation came in hot in October. Fed governor Christopher Waller said he would back a hike in December even if prices cooled, and that a double-sized hike should be considered if they didn't. They didn't. Core prices, which strip out food and energy, rose 0.3% for the third month in a row, more than expected. So now it's 25 or 50.
It's a tidy story. But tidy stories are worth questioning, because the size of the hike only matters once you know what the hike is chasing.
The evidence
One number tells you more than the debate. Gasoline in the US is up 37.4% on a year ago. That is what a fuel shock looks like. The part that matters is where it goes next. Core goods, excluding used cars, rose 0.4% in October, the biggest monthly jump since January. The shock is leaking out of the fuel tank and into everything else.
That is a wave spreading, not a spike fading.
Inflation comes in waves
In 2023 I wrote that inflation comes in waves, and that the 1970s had three of them. The first was the 1973 oil shock. The second was stagflation, which is high prices with a stagnant economy. The third came at the end of the decade, set off by the Iranian Revolution in 1979. I didn't plan on Iran being back in the story. The pattern did.
Here is how a wave works. A shock hits and prices jump. Central banks tighten, prices cool and everyone relaxes. Then the next shock arrives and lands on a system that never fully reset what it expects. In the 1970s the Fed under Arthur Burns was slow, then stop-start, easing before the job was done. Then Paul Volcker hiked rates to around 19%. Prices broke, but the cost was brutal.
And that brutal cost went on for 15 years. It peaked at the double top which you can see in the brown line below. It then took the second leg of the recession for it to fall below 3% before popping up again to 5% in the late 1980s. Inflation finally subsided with the recession of 1990/91. And it stayed low through the dotcom crash and the GFC. Inflation reappeared after the COVID lockdowns in the wake of supply chain disruptions and more than $6 trillion of monetary and fiscal stimulus in the U.S. alone.
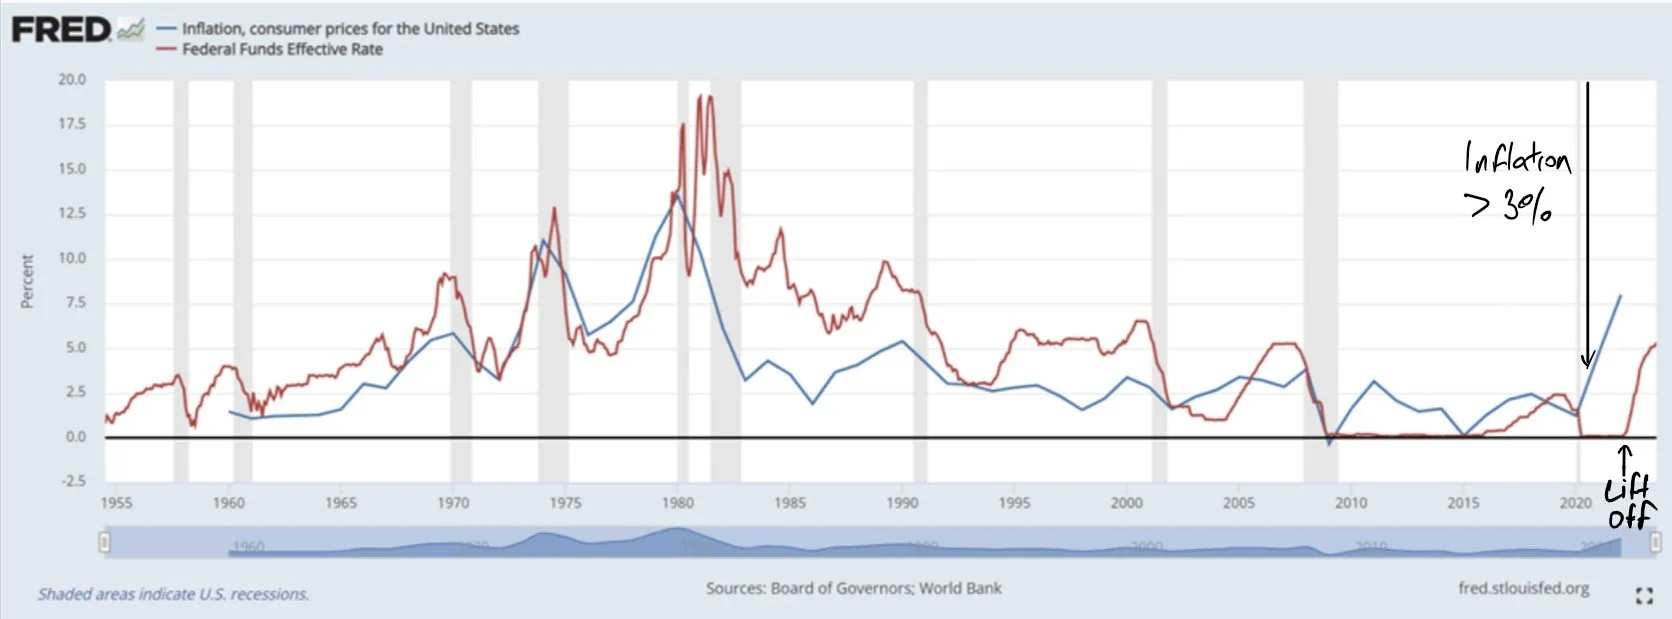
Source: FRED, U.S. Federal Reserve System
The lesson isn't that we need a Volcker today. The lesson is about speed.
Small steps are easy for everyone to adapt to, including the people setting prices. Picture a surfer paddling out through the waves. Small and polite strokes keep dragging you back to the spot where the waves break. One or two fast and hard strokes get you out the back. But those hard strokes are exhausting, and the people who tire first are borrowers.
Where we are now
Waller said hiking only 25 would put the Fed's credibility at risk. He isn't arguing about maths. He's arguing about belief. And the market isn't buying it. It gives a 50 in December roughly one chance in ten and expects a staircase of 25s instead. That disbelief is what keeps the term premium alive. If investors think the Fed won't move fast enough to reverse the small and polite strokes, they keep charging for the risk.
And the yield curve, today’s most important indicator, stays steep, or steepens a little more.
In April I asked whether the bond market was pricing inflation or risk. My answer was mostly risk, which is to say that the term premium, i.e., the extra return investors demand for lending for a long time was being driven by risk.
Seven months on, the answer looks like both. Core inflation is stubborn, and the 10-year Treasury yield touched 5.36% in October, the highest since June 2007, 16 months before Lehman collapsed.
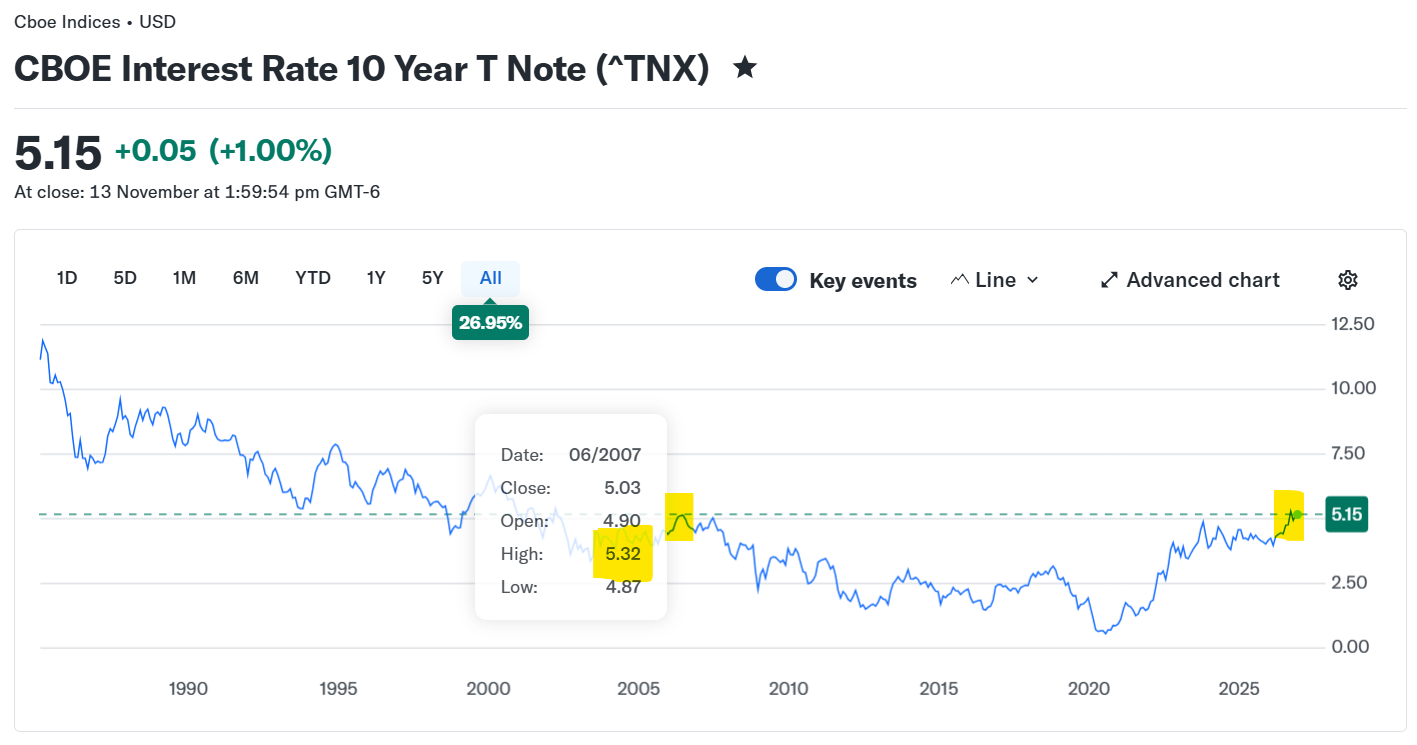
Source: Yahoo Finance
Two things are keeping mid/long yields high.
The first is the risk that the Fed is behind the inflationary wave. The second is cash. As I wrote last week, the TGA, the US government's bank account, is still holding cash it pulled out of markets, so money is tighter than it looks. So, less liquidity around for the same amount of assets and goods keeps a floor under the cost of that liquidity, i.e., yields.
Oil has dropped sharply on hopes of peace, with Brent losing 16% in a week.
I don't think that settles it. Thirty-seven ships were attacked in and around the Strait of Hormuz in October, the most since the war began. A new Congress in January lets Washington argue about the war. It doesn't end it, and it doesn't take away the one lever Iran has found that works. Markets can price in peace long before the Strait delivers it. But the yield curve is steepening, not flattening.
So, what was it, really?
The size of the hike is the loudest part of the story and the least important. The real choice is slow pain for longer like the proverbial boiling frog, or sharp pain for shorter. And your indicators are both ends of the U.S. treasuries yield curve.
I suspect FOMC (the Fed committee that sets the Federal Funds Rate) settles on 25, not the 50 Waller floated. If it does, stubborn inflation and a higher short-end with a risk-priced long end will sit side by side for longer. The 1970s tried the stop-start version and got a decade of waves.
Earlier this year, Fed governor Michael Barr called creating reserves costless. That remark sparked my piece on the three circles of inflation. The first two circles, money creation and asset prices is where the real damage is done, and the tax is levied silently. They never show up in the official measure.
But the third is the one you see in the shops, the only one the Fed, the PBOC, the BoE, the RBA and other sovereigns are measured on, and it’s where Waller's 50 lands.
Creating money initially costs the Fed nothing, but stopping the CPI and PCE inflation that follows does. Somebody always pays, and December decides who, how fast, and for how much longer.
Whatever the Fed decides, the cause underneath doesn't change. A shock started a wave, and a calm fooled traders into thinking it was over.
Watch the waves, not the number
Next time the market is arguing about a number, ask a different question. Is this a new problem, or the next wave of an old one? And who pays for the (lack of) speed of the response?
The headlines count basis points. The waves count the lulls. Inflation doesn't end when it falls. It ends when people stop expecting it to come back. It’s psychology.
And along with some other risks, it’s reflected in the short end of the yield curve (watch the two year) and the long end (watch the term premium) and of course, the USD which is still strong and still taxing liquidity despite oil having rolled over.
The yield curve is the chart of truth, the NASDAQ lags.
See you out the back 🖐
Mike

Macro first. Strategy second. Deal third.
An independent corporate development studio, established in Perth in 2001, advising you when — and when not — to do the deal. In 25 years, that discipline has been the difference.
This content is copyright NextLevelCorporate. It is not advice and it is provided for informational purposes only. NextLevelCorporate and logo are registered trademarks. All rights reserved.